Figure 2.

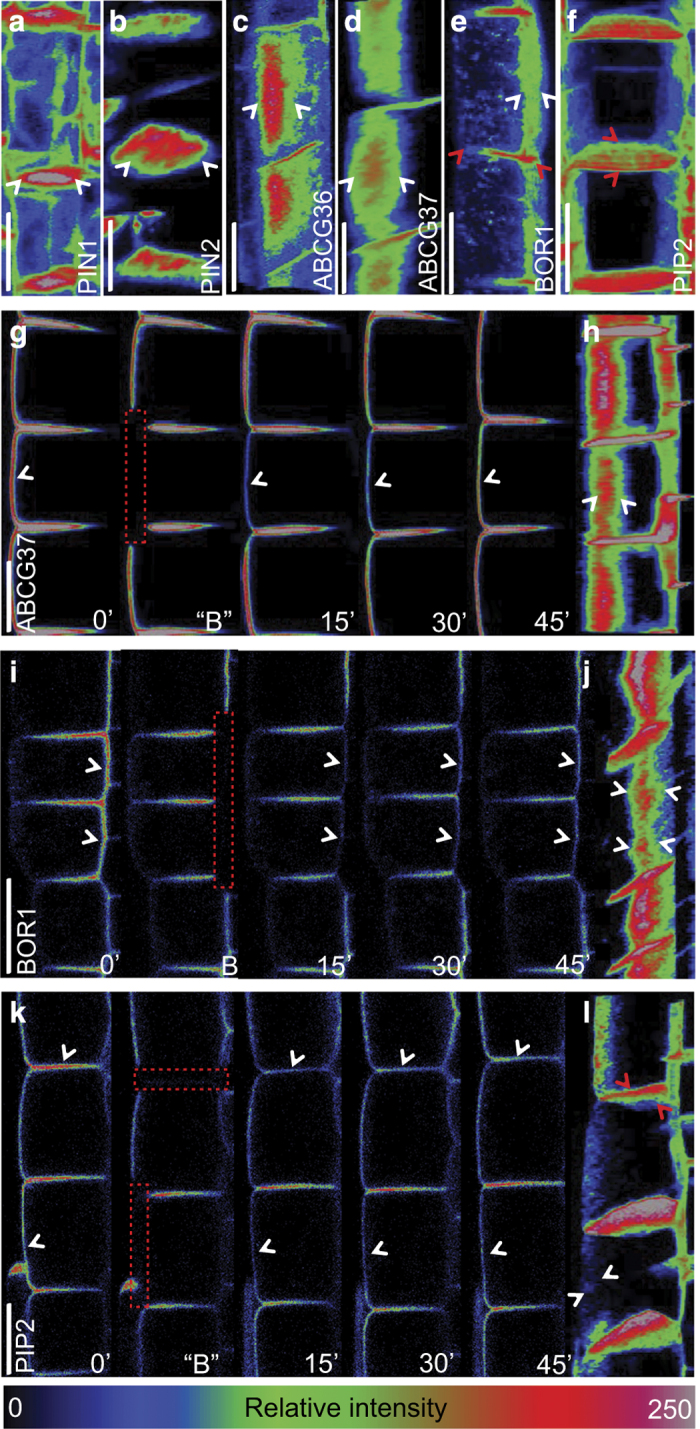
Super-polar delivery revealed by 3D reconstructions of polar cargo localizations. (a–f) Projected 3D reconstructions of z-stacks of different polar markers, highlighting their spatial distribution in the respective polar domains for PIN1-GFP (a), PIN2-GFP (b), ABCG36-GFP (c), GFP-ABCG37 (d), and BOR1-GFP (e). The white arrowheads mark the gradual signal decrease at the edges of respective polar domain. In addition, at transversal domains (merged apical/basal), BOR1-GFP and PIP2-GFP show a strong signal gradient decreasing toward the root surface (e) and from the root surface (f), respectively (red arrowheads). With the exception of PIN1, which occurs in the stele, all markers were analyzed in epidermal cells. (g–l) Dynamics of fluorescence recovery of GFP-ABCG37, BOR1-GFP, and PIP2-GFP over a time-course of 45 min after photobleaching (dashed red rectangles indicate photobleached regions). In single z-sections an equal signal recovery over the whole length of the domain (arrowheads) can be seen for GFP-ABCG37 (g), BOR1-GFP (i), and PIP2-GFP (k). In contrast, on 3D reconstructions at 45 min after photobleaching GFP-ABCG37 (h), BOR1-GFP (j), and PIP2-GFP (l), reveal a signal enrichment in the middle core of outer lateral domains (white arrowheads). In addition, non-polar marker PIP2-GFP shows different recovery pattern at transversal domain in comparison to outer lateral domain, displaying signal recovery at the periphery of the domain instead of in the middle core (l) (red arrowheads). Relative fluorescence intensity from 0 (black)–250 (bright/white) is represented by the color code. n=6–8 FRAP experiments on different roots. Scale bars=10 μm.
