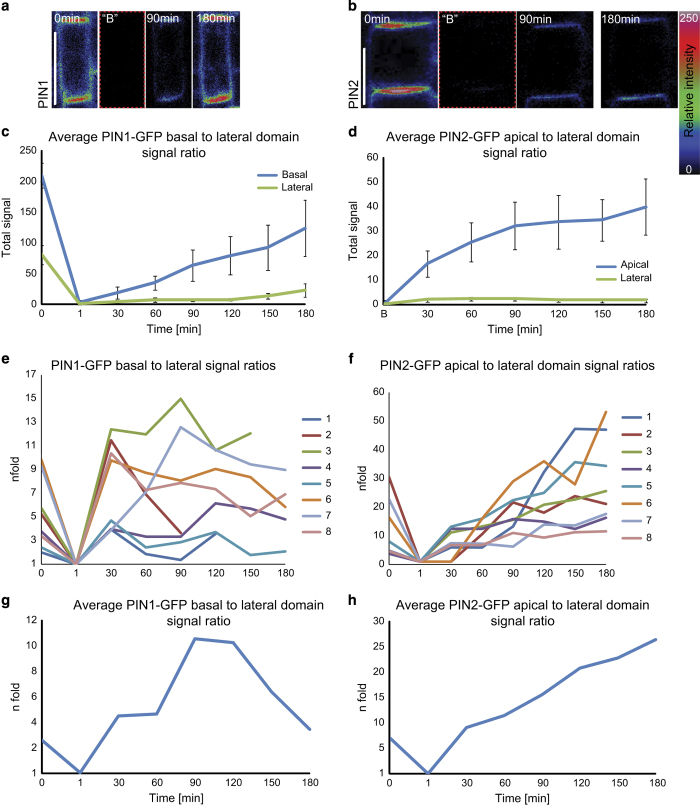
Figure 6.
Quantitative analysis of PIN1 and PIN2 signal recovery at the PM after complete cell photobleaching. (a, b) Whole-cell FRAP of PIN1-GFP (a) and PIN2-GFP (b) shows predominant signal recovery at the respective polar domains. Relative fluorescence intensity from 0 (black) to 250 (bright/white) is represented by the color code. Scale bar=10 μm. (c, d) Quantification of the signal intensity recovery for PIN1-GFP (c) and PIN2-GFP (d) at the polar and non-polar domains. The signal values of prebleach and postbleach fluorescence intensities were normalized and error bars are s.e.m. n=8 FRAP experiments on different roots. (e–h) Dynamics of polarization of recovering fluorescent signal as depicted as the evolution of the ratio of signal intensities (polar vs lateral) for PIN1-GFP (e, g) and PIN2-GFP (f, h) over time. In the graphs e, f each of colored profiles (numbered 1–8) represent the ratio dynamics of signal intensities calculated from individual FRAP experiments.

