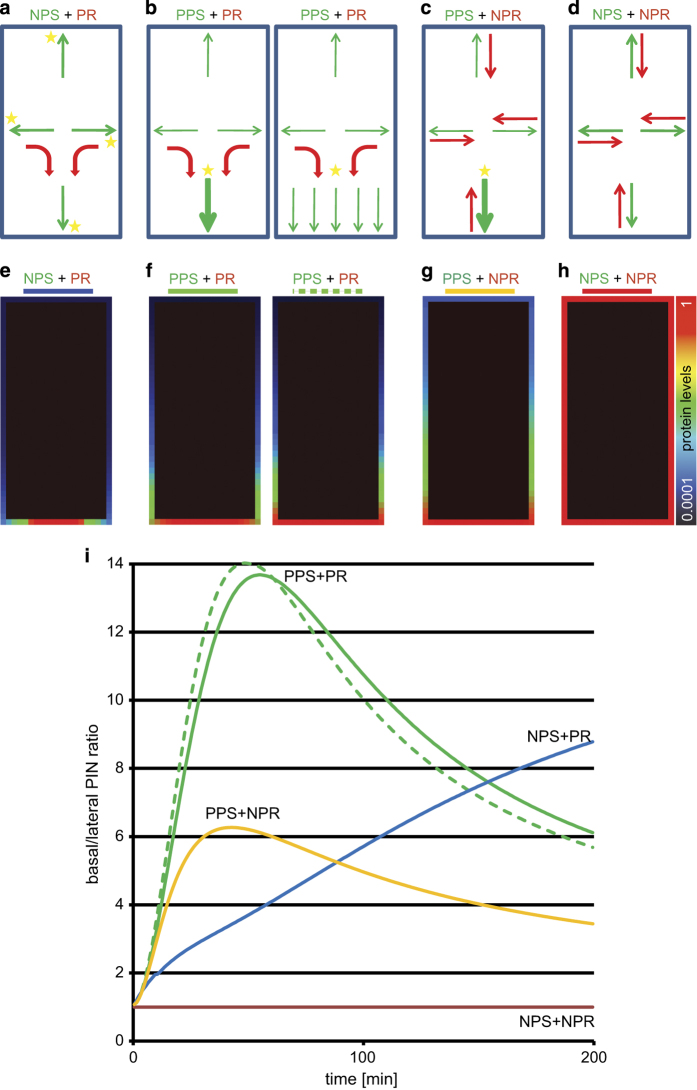
Figure 7.
Computer simulations of two alternative secretion scenarios. (a–d) Hypothetical models assuming non-polar secretion and polar recycling (a); preferential polar secretion and polar recycling (left and right panels refer to protein polar recycling to the center and to the whole-polar domain, respectively) (b); preferential polar secretion and non-polar recycling (c); non-polar secretion and non-polar recycling model (d); (NPR, non-polar recycling; NPS, non-polar secretion; PPS, preferentially polar secretion; PR, polar recycling). The thickness of the arrows indicates the protein trafficking intensity (green, secretion; red, recycling), and the stars position the cargo-targeting specifying determinants. (e–h) Computer simulations of protein polarization referring to the hypothetical models as described above, respectively. Only model assuming non-polar secretion and non-polar recycling is completely unable to establish cell polarization (h). Protein levels are represented by color coding scheme, from low (0.0001) to high (1) (log scale). (i) Evolution of signal intensity profiles obtained after an extended simulation time for models: assuming non-polar secretions and polar recycling (blue line), polar secretions and polar recycling to the polar domain center (green solid line), polar secretion and polar recycling equally to the whole-polar domain (green dashed line), and as a reference models assuming polar secretion and non-polar recycling (yellow line), and non-polar recycling and non-polar secretion (red solid line). See also Materials and Methods section for a detailed description of the models.

