Fig. 3.

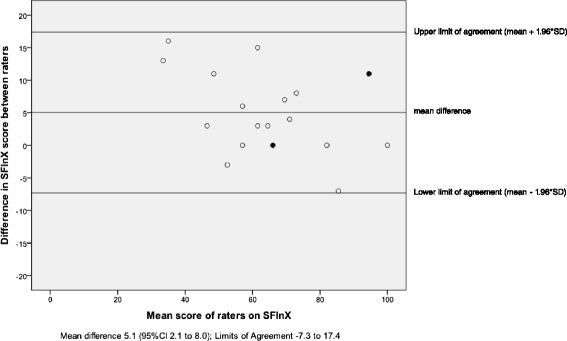
Bland and Altman-plot with 95 % Limits of Agreement for SFInX total score absolute agreement between raters (full black dots represent change scores of two participants)

Bland and Altman-plot with 95 % Limits of Agreement for SFInX total score absolute agreement between raters (full black dots represent change scores of two participants)