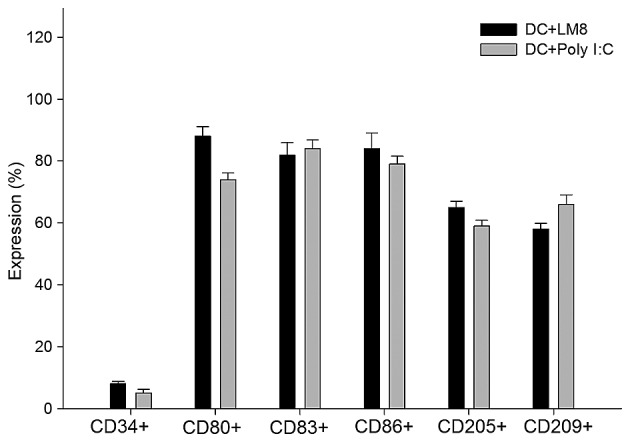
Figure 2.

Percentage DCs expressing cell surface markers, as measured by flow cytometry. DCs were pulsed with LM8 cell lysate (DC+LM8) or matured in poly I:C without cell lysate (DC+Poly I:C). Results represent the mean of three experiments ± standard deviation. DC, dendritic cell; Poly I:C, polyinosinic:polycytidylic acid; CD, cluster of differentiation.
