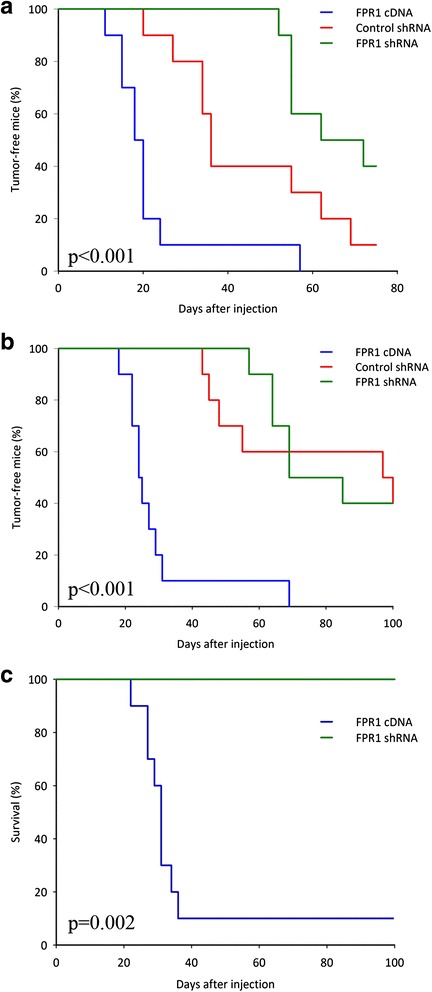
Fig. 5.

FPR1-dependent tumor development and survival in animal model. Cell lines with different expression level of FPR1 were subcutaneously injected into mice, and tumor growth was recorded. Kaplan-Meier curves represent the time until tumors reached a volume of 0.2 cm3 (a) and 0.5 cm3 (b). Survival plot (c) shows the difference in survival between animals with high and low expression levels of FPR1 (the criterion for endpoint was a tumor volume ≥ 1 cm3)
