Figure 1.

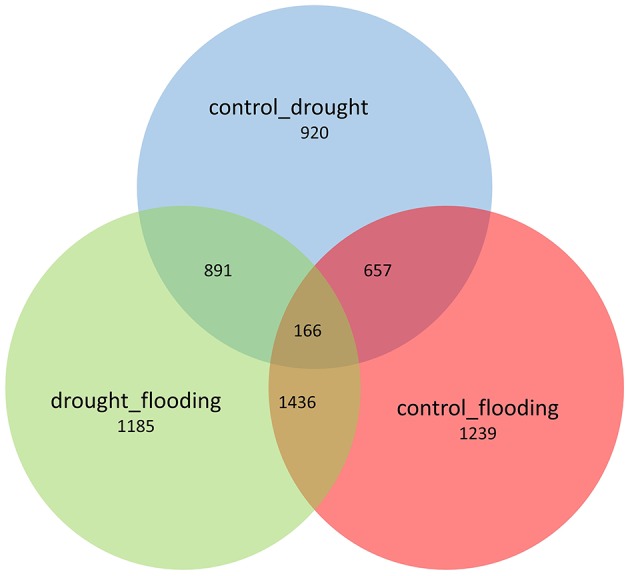
Venn diagram representing the specific and common DEGs across the control vs. drought, control vs. flooding, and drought vs. flooding conditions.

Venn diagram representing the specific and common DEGs across the control vs. drought, control vs. flooding, and drought vs. flooding conditions.