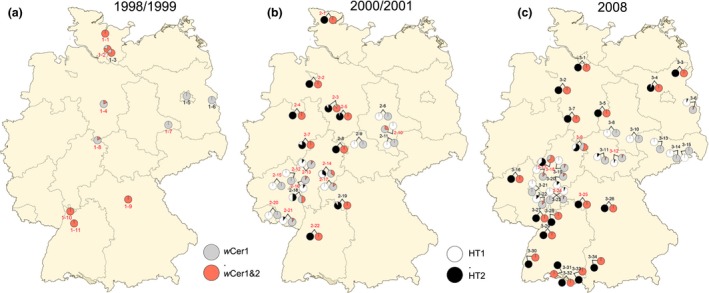
Figure 2.

Geographic distribution of Wolbachia and mitochondrial haplotypes of R. cerasi. (a) Wolbachia and mitochondrial haplotype frequencies in 1998/1999, (b) in 2000/2001, and (c) in 2008. White = proportion of individuals from HT1, black = proportion of individuals from HT2, grey = proportion of wCer1 singly infected flies and red = proportion of wCer1&2 doubly infected flies; black numbers represent flies collected from Prunus while red numbers represent populations from Lonicera. Population localities and numbers are listed in Table S1 (Supporting information).
