Figure 4.
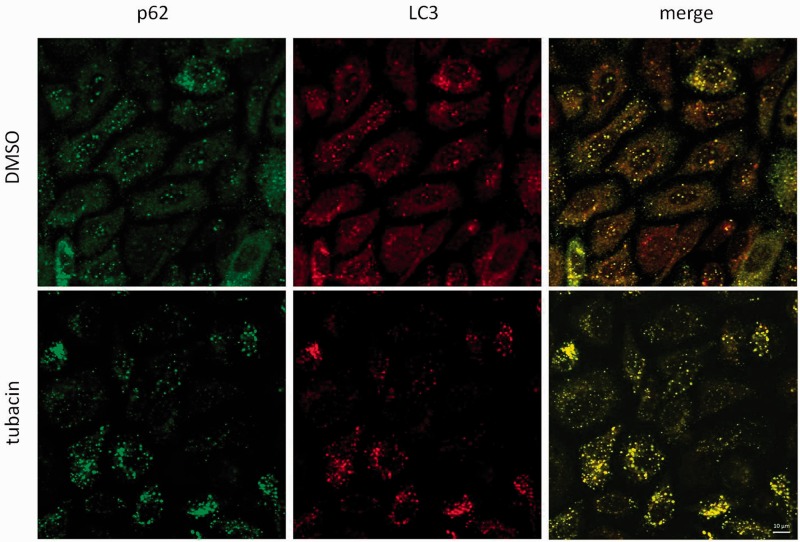
Tubacin leads to the appearance of LC3 puncta in PC3 cells. PC3 cells were treated with control (DMSO) or tubacin for 24 h prior to processing for p62 (green) and LC3 (red) visualization by confocal microscopy. Tubacin led to an increase in LC3 puncta in PC3 cells. LC3 puncta colocalized with p62 foci. Scale bar is 10 µm

