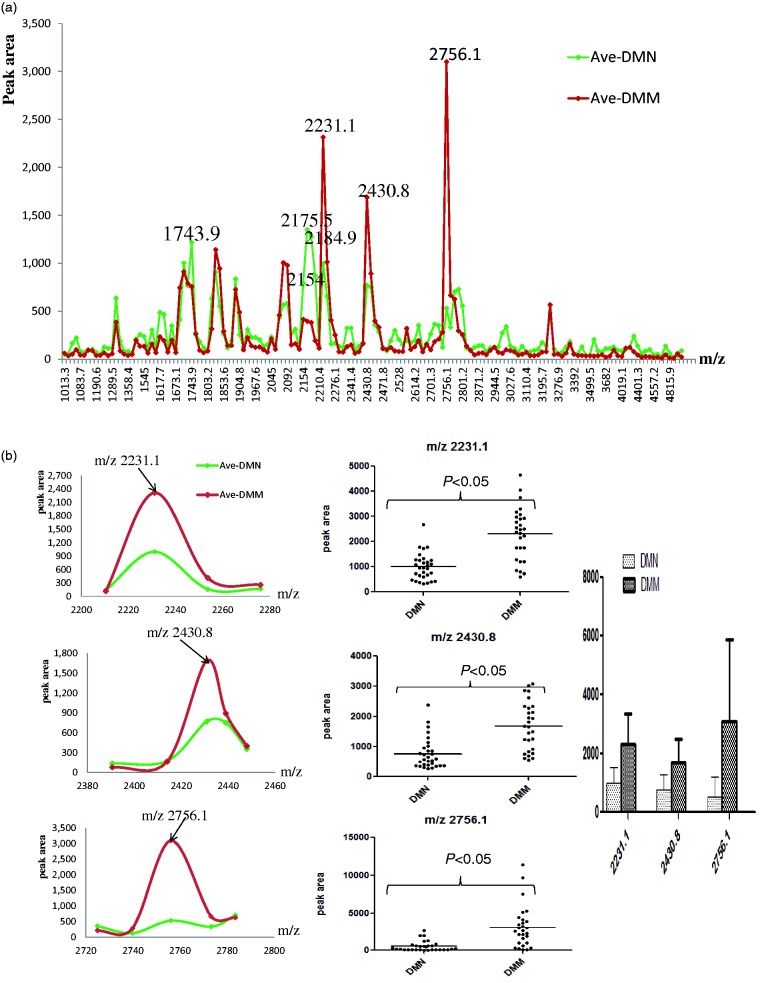
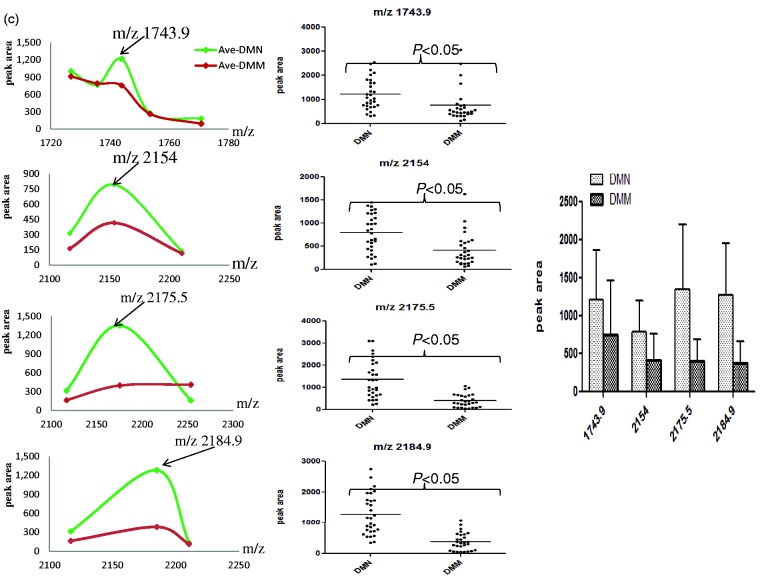
Figure 2.
The features of the seven selected peaks in two groups of type 2 diabetic patients. (a) The distribution of average peak area from two groups. (b) The average values of three up-regulated peaks in two groups (left and right) and their distribution in all samples (middle). (c) The average value of four decreased peaks in two groups (left and right) and their distribution in all samples (middle). (A color version of this figure is available in the online journal.)


