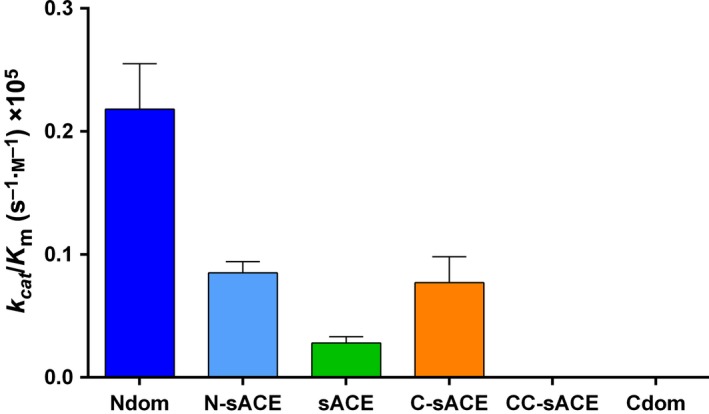
Figure 4.

Graphical representation of the overall kinetic efficiency of Aβ(4–10)Q. The data indicate hydrolysis of Aβ(4–10)Q by truncated, full‐length and wild‐type ACE constructs (error bars indicate the fractional error of the ratio; n = 3; colour coding as in Fig. 1).
