Figure 1.
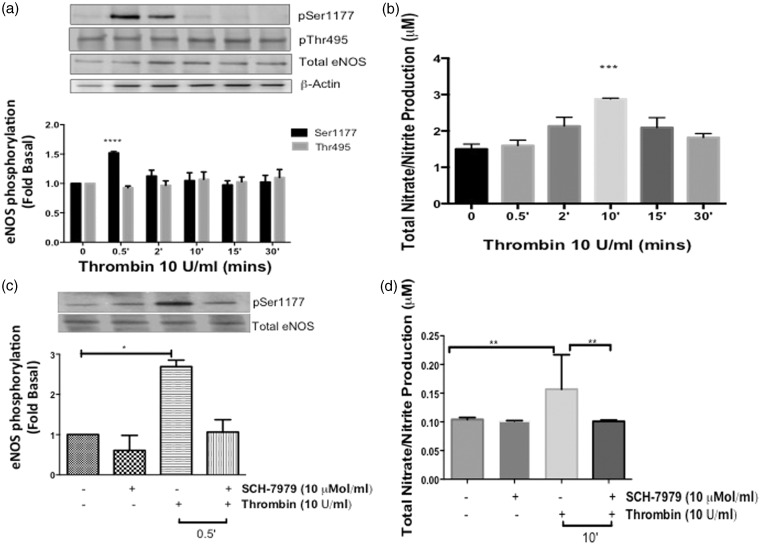
Effects of thrombin on eNOS phosphorylation and NO production in HCAECs (a) HCAECs were stimulated with thrombin (10 U/ml) for the indicated time points and phosphorylated eNOS-ser1177 and eNOS-Thr495 were determined using Western blot analysis with phosphospecific antibodies. Representative immunoblots are shown with densitometric analyses. Mean +/− SEM of measurements in cultures of five different passages; ****P < 0.0001 Thrombin 0.5 min versus Basal. (b) NO production was determined indirectly by measuring total nitrate/nitrite using media from HCAECs treated with thrombin (10 U/ml) for the indicated time points. n = 5, ***P < 0.05 Thrombin versus Basal. (c) Cells were pretreated with SCH-79797 (10 µmol/L) or vehicle (0.01% DMSO) for 1 h prior to stimulation with thrombin (10 U/ml) for 0.5 min. Phosphorylated eNOS-Ser1177 and eNOS-Thr495 were determined using Western blot analysis with phosphospecific antibodies. Representative immunoblots are shown with densitometric analyses. Mean +/− SEM of measurements in cultures of four different passages; *P < 0.001 Thrombin versus Vehicle. (d) Total nitrate/nitrite production was measured using media from HCAECs pretreated with SCH-79797 (10 µmol/L) or vehicle (0.01% DMSO) for 1 h prior to stimulation with thrombin (10 U/ml) for 10 min n = 3, **P < 0.05 Thrombin versus Basal and SCH + Thrombin 10 min

