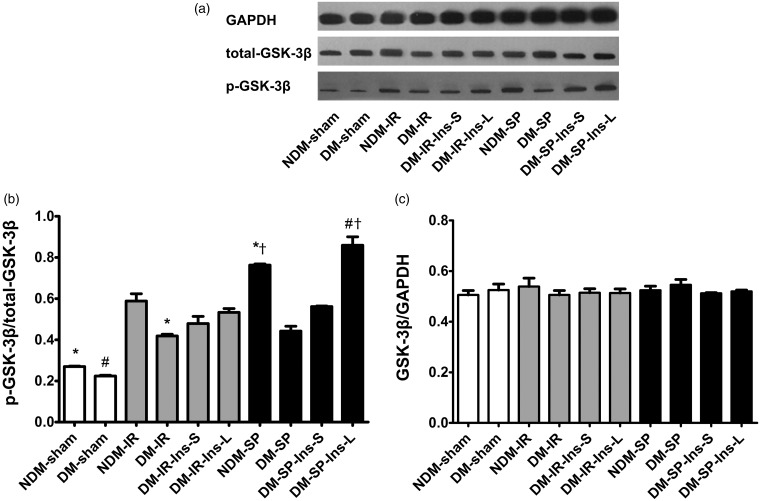
Figure 3.
Expression of GSK-3β and p-GSK-3β in rat myocardium at the end of 120-min reperfusion. (a) Cardiac tissues were collected for detecting GSK-3β and p-GSK-3β expressions by Western blotting; (b) bar graph represents averaged total-GSK-3β expressed as percentage of GAPDH and as mean ± SD., n = 4 per group; (c) bar graph represents averaged p-GSK-3β as percentage of total-GSK-3β and expressed as mean ± SD., n = 4 per group.
NDM: non-diabetic rats; DM: diabetic rats; IR: ischemia/reperfusion; SP: sufentanil postconditioning; Ins-S: two-day short-term insulin treatment; Ins-L: two-week long-term insulin treatment.
*P < 0.05 vs. NDM-IR group; #P < 0.05 vs. DM-IR group; †P < 0.05 vs. DM-SP group

