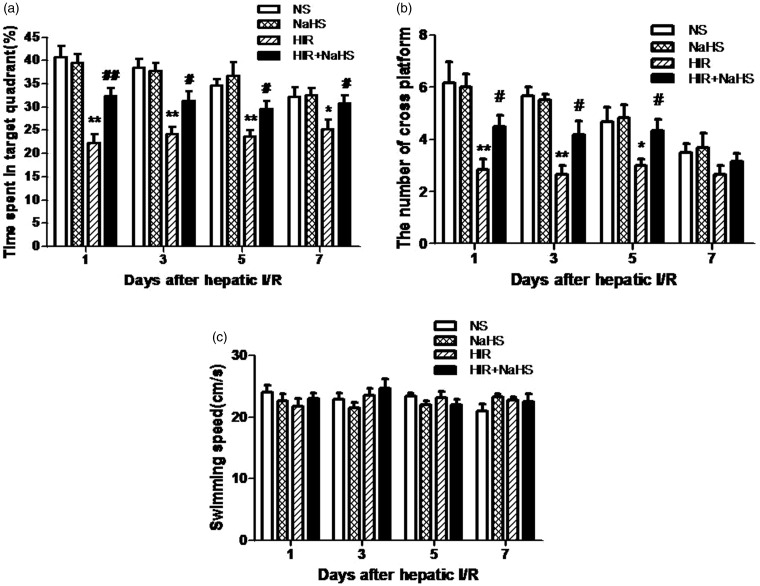
Figure 3.
NaHS ameliorated cognitive impairment after hepatic I/R. (a) Percentage of time spent in the target quadrant, (b) number of crossings over the platform, (c) swimming speed during the probe phase. The data are expressed as mean ± SEM. *P < 0.05 HIR versus NS, **P < 0.01 HIR versus NS, #P < 0.05 HIR + NaHS versus HIR, ##P < 0.01 HIR + NaHS versus HIR

