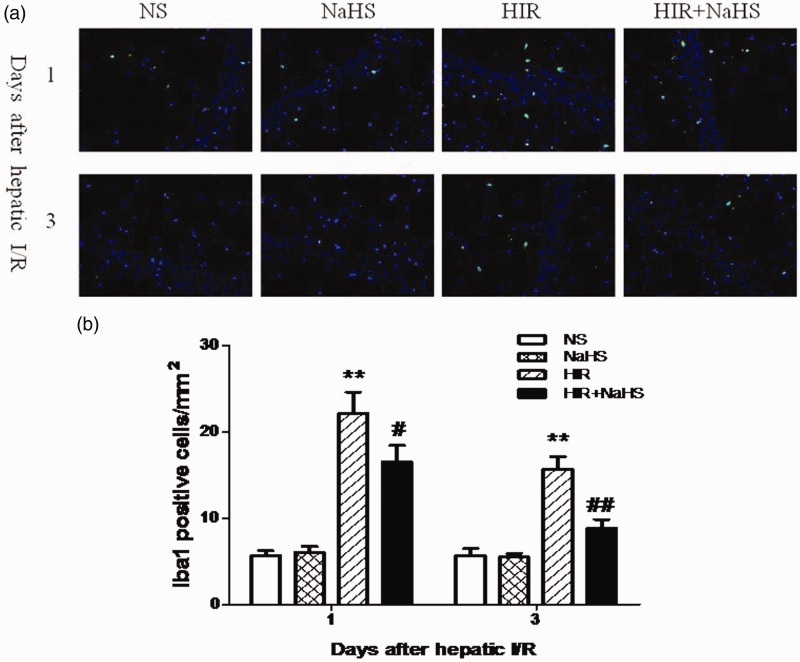
Figure 6.
NaHS decreased hippocampal Iba1 expression. (a) The distribution and number of hippocampal Iba1-positive cells (magnification × 400). (b) Quantitative analysis of hippocampal Iba1-positive cells. The data are presented as mean ± SEM. **P < 0.01 HIR versus NS, #P < 0.05 HIR + NaHS versus HIR, ##P < 0.01 HIR + NaHS versus HIR. (A color version of this figure is available in the online journal.)

