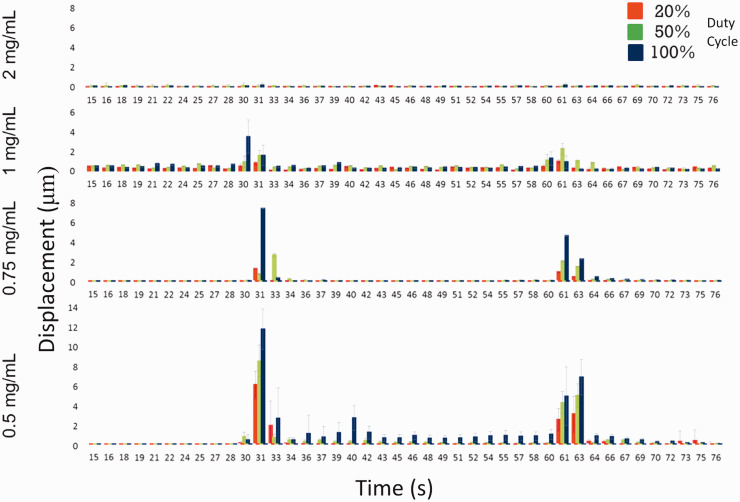
Figure 2.
The displacement of individual beads encapsulated within the hydrogels was tracked and recorded using Volocity™ Software. The mean total displacement in the x, y, and z planes was recorded every second for 90 s; 30 s prior to the onset of ultrasound, 30 s during ultrasound, and 30 s after ultrasound had been turned off. For each hydrogel formulation and duty cycle, the displacement of 10 beads was tracked and recorded. Data show a relationship between hydrogel concentration and overall bead displacement, with lower concentrations of hydrogel showing larger bead displacements, and a relationship between increasing duty cycle and bead displacement, with higher duty cycles showing larger displacements within each hydrogel concentration. Evidence of bead displacement at 30 s, corresponding to the onset of ultrasound, and at 60 s, corresponding to the cessation of ultrasound, suggest that the hydrogels moved with the onset of ultrasound and then partially recovered their original shape after ultrasound. (A color version of this figure is available in the online journal.)

