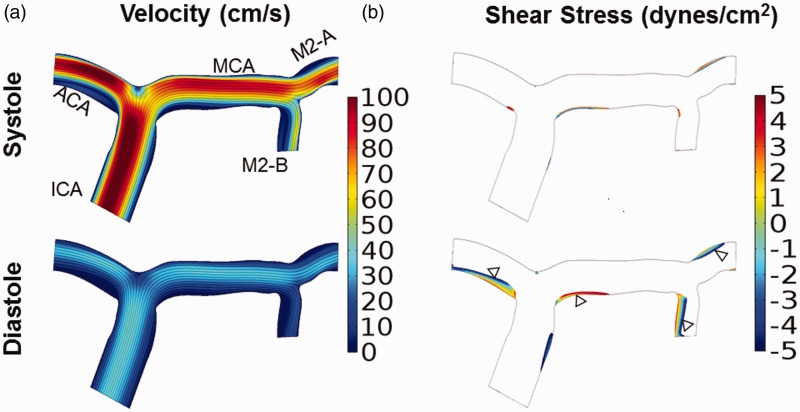
Figure 2.
Elevated internal carotid artery velocities caused by sickle cell anemia does not generate velocities greater than 200 cm/s in the middle cerebral artery. Velocity and shear stress profiles were calculated for a 2-D arterial model with the TAMMV of the ICA inflow velocity set to those of a patient with SCA (70 cm/s). (a) Velocity during systole and diastole. Velocity was highest in the ICA and ACA, and the maximum velocity in the MCA did not exceed 90 cm/s. (b) Regions of low wall shear stress during systole and diastole are depicted with a maximum threshold of ± 5 dynes/cm2 . The affected regions correlate to regions with low velocities (a), and include the apex of the terminal end ICA bifurcation and inner curvature of bifurcations

