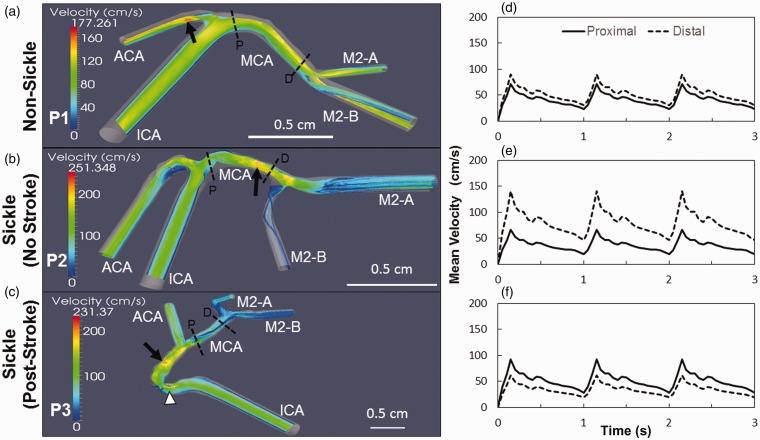
Figure 5.
Velocity profiles in the middle cerebral are elevated in individuals with sickle cell anemia. Slices of the velocity streamlines are depicted for the each subject during systole. The maximum velocity in the non-sickle patient (P1) is highest in the ACA (arrow), and the MCA presents a consistent profile that peaks at ∼150 cm/s (a). In the sickle patient with no stroke (P2), the velocity is highest in the MCA (arrow), increasing from the proximal to the distal end with a maximum speed of 251 cm/s (b). The sickle subject with a previous history of stroke (P3) has the highest velocity occurring along the ICA prior to the bifurcation (arrow) and at the stenosis (arrowhead). The maximum velocity in the MCA reaches approximately 180 cm/s at the proximal end and decreases towards the distal MCA bifurcation (c). The velocity in the MCA of P1 has the least variance with the velocity at the proximal and distal ends reaching 72 and 90 cm/s, respectively (d). The velocity profile in the MCA of P2 has the largest variance amongst all the subjects with velocity increasing from the proximal end at 66 cm/s to the distal end at the 141 cm/s (e). Subject P3 has its velocity in the MCA decrease from 92 cm/s at the proximal side to 61 cm/s at the distal end (f). Scale bar is shown

