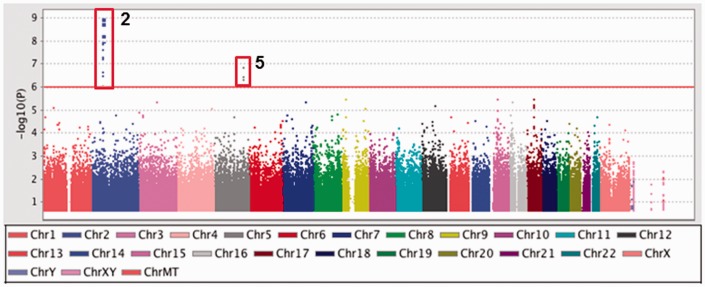
Figure 1.
Analysis of GWAS data by PLINK. The genotype data generated by the entire cohort were subjected to case-control association analysis using PLINK. Log-transformed P values (y axis) for the top 200,000 SNPs were plotted against chromosomal location (x-axis) using Haploview. The vertical red box shows significant SNPs in the BCL11A (Chr2) and SPARC (Chr5) genes

