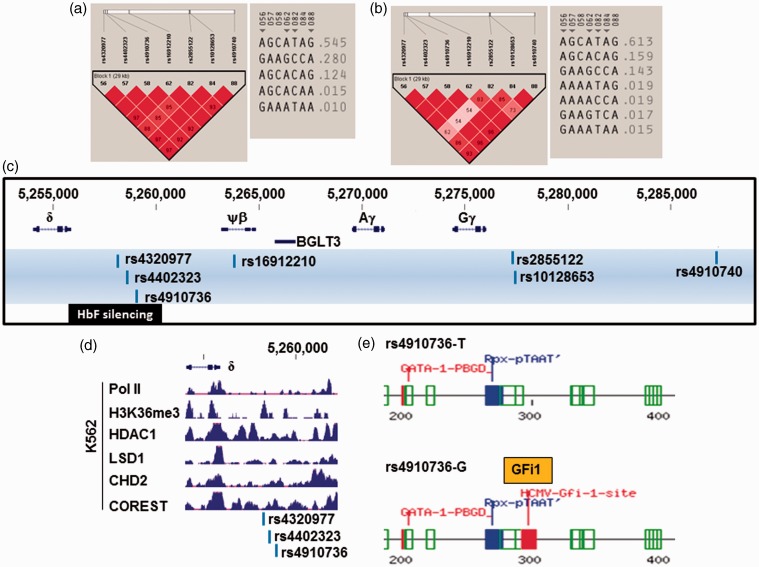
Figure 4.
HBB locus SNPs potentially involved in γ-globin gene silencing. (a) The LD profile for the low HbF group is shown on the left. The color scheme for LD pattern is as defined in Figure 3(b). The inferred haplotypes for these SNPs are depicted on the right. (b) The LD pattern and inferred haplotypes for the high HbF group. (c) The HbF-associated SNPs identified in the HBB locus between 3′ ɛ-globin and δ-globin, and the HbF silencing regions are shown. (d) K562 ChIP-seq data from the ENCODE project. Shown are the tracks for the proteins indicated between positions 5,254,000 to 5,262,140. The three HbF-associated SNPs are indicated at the bottom. (e) A 300-bp region around rs4910736 was analyzed by Tfsitescan software to identify predicted transcription factor binding sites. The results for the T allele and G allele are shown on the top and bottom, respectively. Binding sites for LIM homeodomain-containing proteins (Rpx-pTAAT) and GATA-1 were predicted regardless the presence of T or G allele indicative of the change of binding site by rs4910736. Various colors were used to represent E (expected) values for the prediction. The lower the E value, the higher the probability of transcription factor binding to the predicted site. Code: green – E values from 0.1 to 0.01; red – E values from 0.01 to 0.001; and blue – E values from 0.001 to 0.0001. Note the GFi1 predicted DNA motif has an E value in the same range as the predicted GATA-1 site

