Figure 5.
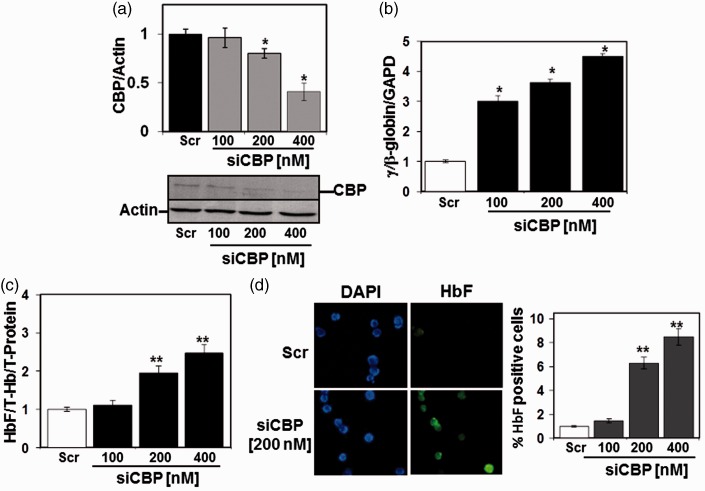
CBP gene silencing induces γ-globin expression in primary erythroid cells. Using a two-phase liquid cell culture system, erythroid progenitors were generated and transfected at day 28 with siRNA against CBP and changes in γ-globin and HbF expression were quantified (see Materials and methods section). (a) RT-qPCR data for CBP mRNA normalized to Actin. Representative western blots for CBP and Actin expression after siRNA treatment are shown on the bottom; *P < 0.05. (b) RT-qPCR analysis of γ-globin, β-globin and GAPDH mRNA showing the fold change of γ-globin expression under the different conditions. (c) ELISA was performed with HbF and total hemoglobin (Hb) antibodies. Raw data were normalized by total hemoglobin (T-Hb) and total protein (T-Protein) for each sample. (d) Immunocytostaining with anti-γ-globin fluorescein isothiocyanate antibody demonstrated an increase in HbF-producing cells (photomicrograph on left). Quantification of the % HbF-positive cells under the different conditions is shown in the graph; **P < 0.001

