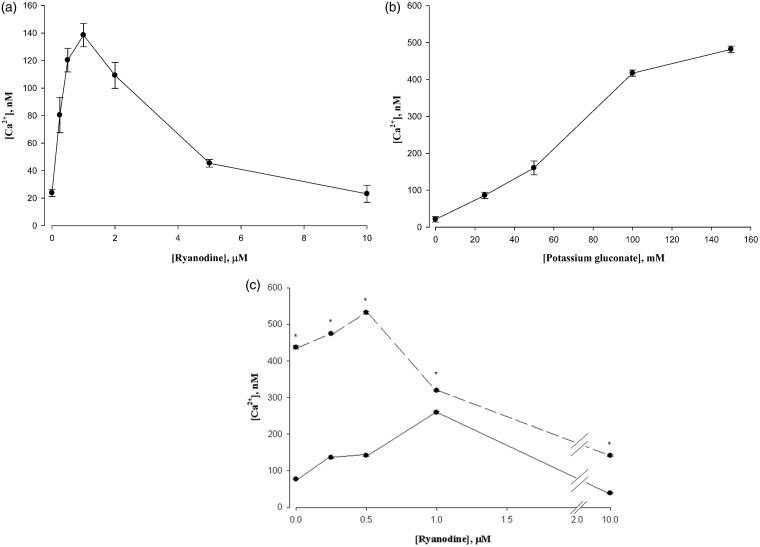
Figure 1.
(a) Biphasic response of L6 cell cytosolic Ca2+ to ryanodine. Ryanodine was present for 2 min prior to Ca2+ measurement by Fura-2 fluorescence. Data are means ± SEM, n = 4. (b) Effect of potassium gluconate on cytosolic Ca2+ in L6 cells. Potassium gluconate was present for 2 min prior to Ca2+ measurement. Data are means ± SEM, n = 4. (c) High K+ sensitives L6 cells to ryanodine. The solid line indicates control cells. The dashed line indicates the presence of 150 mM potassium gluconate. The peak of ryanodine stimulated Ca2+ release was shifted to the left in the presence of potassium. *P < 0.05 versus Control, n = 4

