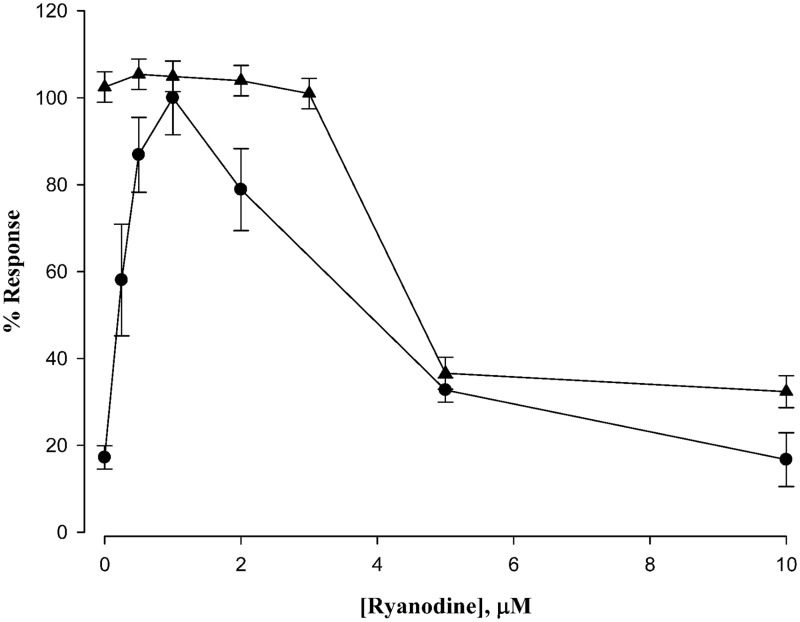
Figure 7.
Comparison of ryanodine-induced calcium responses. The data from Figure 1(a) and an expanded series of data similar to that of Figure 4 were normalized for display on the same ordinate. Ryanodine sensitivity of cells under resting conditions (filled circles) shows a peak calcium release at 1 μM, which was set at 100% for that curve. The calcium currents (an expanded data set of Figure 4) under maximum excitation conditions (+30 mV) was set at 100% and also plotted as a function of ryanodine concentration filled triangles. Data are means ± SEM, n = 4

