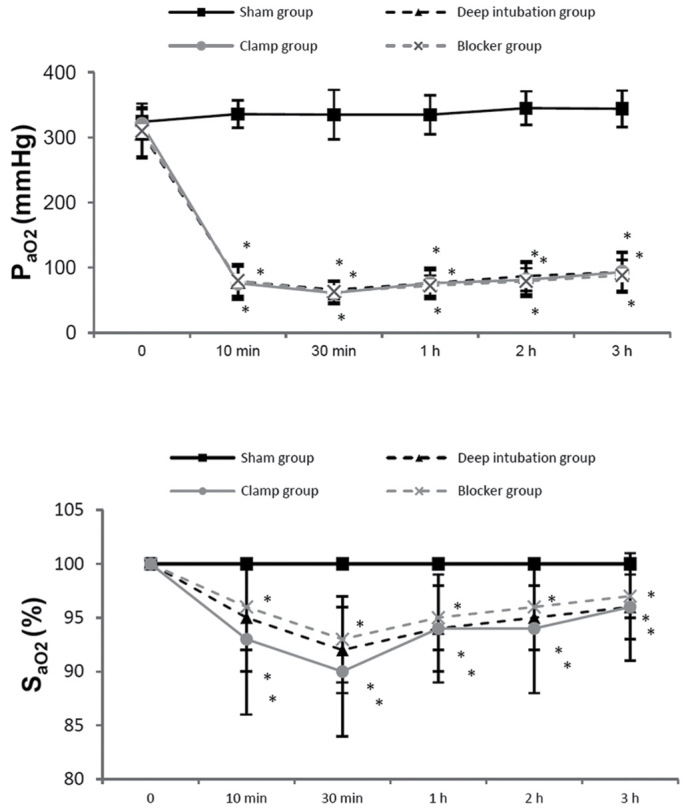
Figure 4.

PaO2 and SaO2 were lower in three one-lung ventilation (OLV) groups at 10 min, 30 min, 1 h, 2 h, 3 h of OLV, compared with sham group, and no differences were detected among the three OLV groups. *P<0.05 vs. sham group. PaO2, arterial partial pressure of oxygen; SaO2, arterial hemoglobin oxygen saturation.
