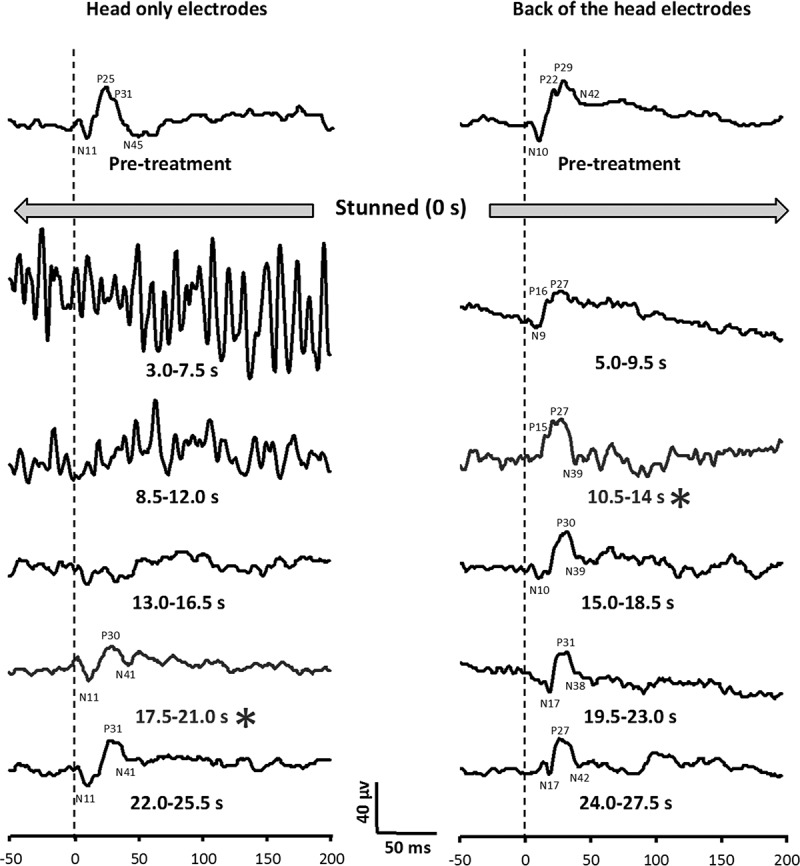
Figure 2.

Experiment 3: examples of visual evoked potentials (VEP) from two hens after stunning with either standard head-only or back-of-the-head electrodes. The * (grey) waveforms are where VEP activity first returned. Each waveform is the average of 15 traces (4.5 s). There was a stimulus delay of 100 ms (50 ms shown) with the stimulus delivered at 0 ms. Time after treatment is from the end of the stun. The dashed line indicates the time of the visual stimulus.
