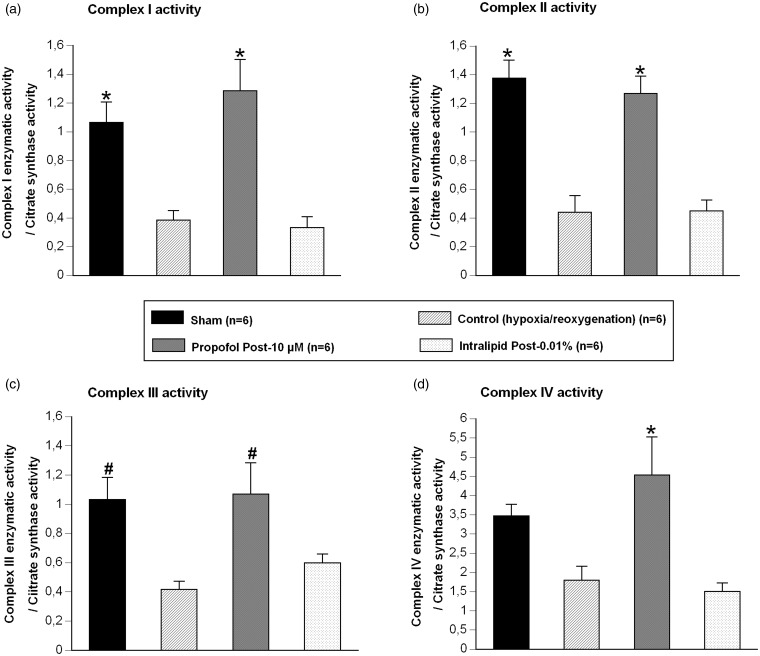
Figure 4.
Activity of complexes of the mitochondrial respiratory chain: the ratio complex 1 enzymatic activity / citrate synthase activity (a), the ratio complex 2 enzymatic activity / citrate synthase activity (b), the ratio complex 3 activity / citrate synthase activity (c), the ratio complex 4 activity / citrate synthase activity (d); in Sham group (n = 6), in group exposed to 30-min hypoxia followed by 15-min reoxygenation period alone (“Control” group, n = 6), in presence of propofol 10 µM during reoxygenation (“Propofol Post-10 µM” group, n = 6), and in presence of intralipid 0.01% during reoxygenation (“Intralipid Post-0.01%” group, n = 6).
Data are mean ± SEM. *P < 0.01 versus “Control” and “Intralipid Post 0.01%” groups; # P < 0.05 versus “Control” group

