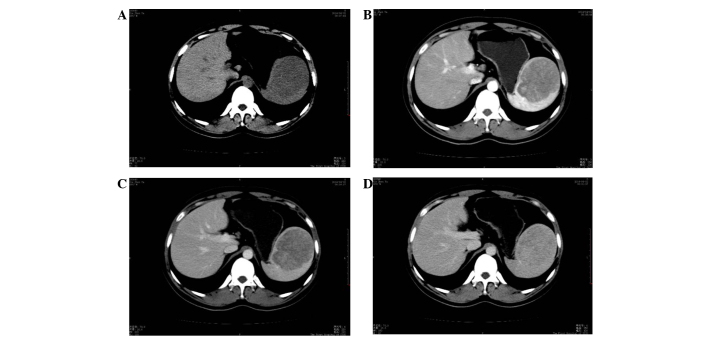
Figure 1.
CT scans of sclerosing angiomatoid nodular transformation. (A) Slightly low density lesion on a plain scanning CT image. (B) The CT value of the mass was clearly lower than that of the surrounding normal spleen on arterial phase-enhanced CT scanning. (C) The CT value of the mass remained lower than that of the surrounding spleen on portal venous-phase enhanced CT scanning. (D) The densities of the mass and the normal surrounding spleen were close on delayed enhanced CT scanning (D). CT, computed tomography.

