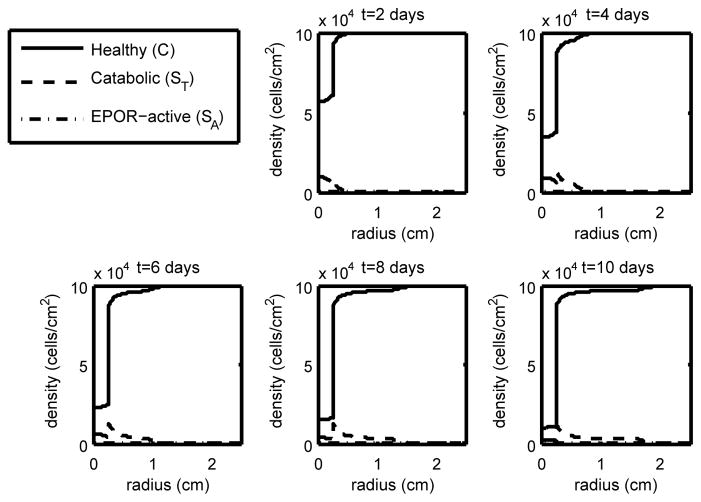
Figure 5.
The density of the healthy, catabolic and EPOR-active chondrocytes (C(r, t), ST(r, t), SA(r, t)) at t = 2, 4, 6, 8, 10 days with ε = 0.6 and σP = 3.3 · 10−3(medium loading with high EPO production). With high EPO production, we see abatement of the penumbra (the region dominated by ST and SA) and thus control of the lesion when compared to the low EPO production cases.

