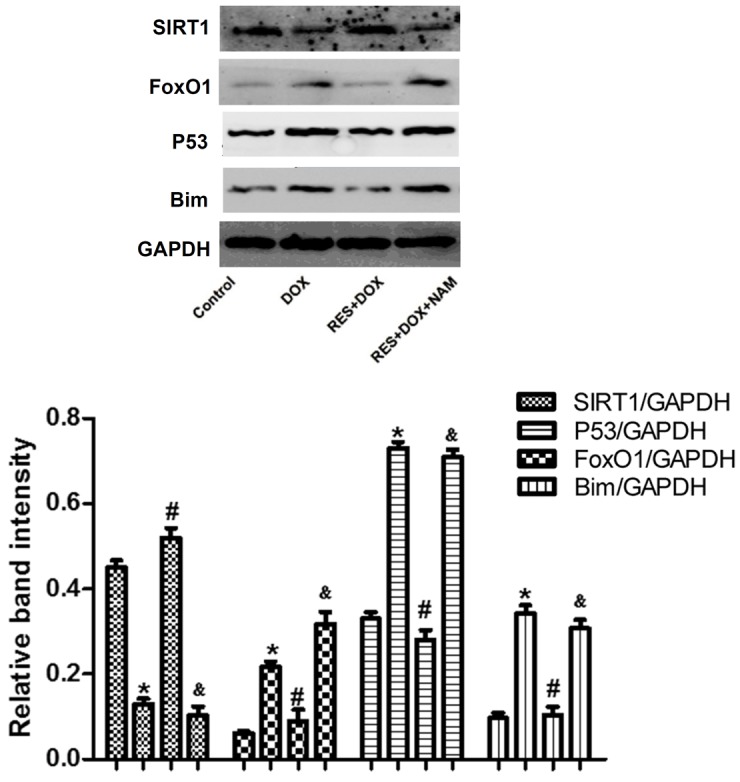
Figure 5.

Protein expression levels of SIRT1, FoxO1, P53 and Bim in H9c2 cells treated with DOX, RES + DOX or NAM + RES + DOX, as analyzed by western blot analysis and quantified by densitometric analysis. Data are shown as the mean ± standard error (n=3). *P<0.05 vs. the control group; #P<0.05 vs. the DOX-treated group; &P<0.05 vs. the RES+DOX group. SIRT1, sirtuin 1; FoxO1, forkhead box protein O1; Bim, Bcl-2-like protein 11; DOX, doxorubicin; RES, resveratrol; NAM, nicotinamide.
