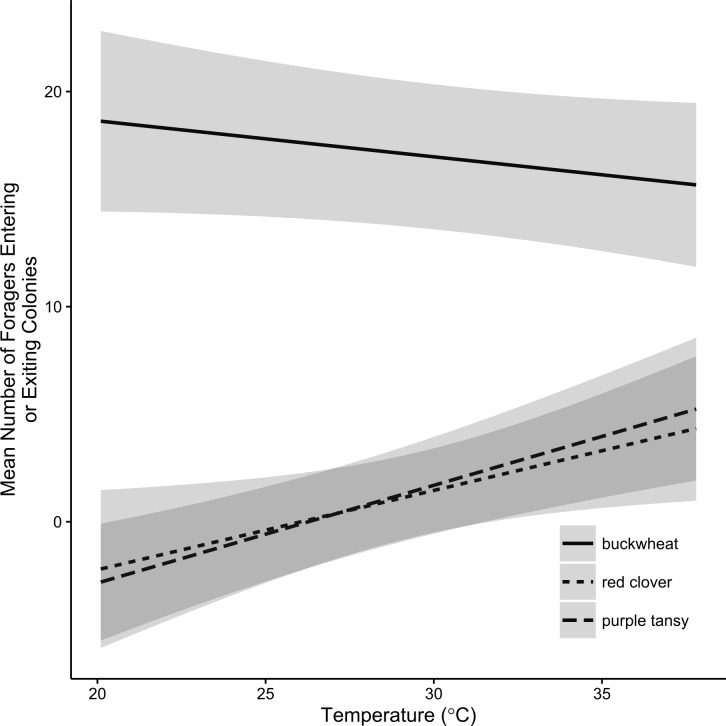
Figure 2. Effect display of the relationship between temperature and Bombus impatiens foraging activity.
Effect display of the relationship between temperature (° C) and the mean number of Bombus impatiens workers entering or exiting colonies on small plots of flowering buckwheat (n = 10), red clover (n = 9), or purple tansy (n = 10) plots per assessment period over 7 observation days. Shaded areas correspond to 95% confidence intervals.

