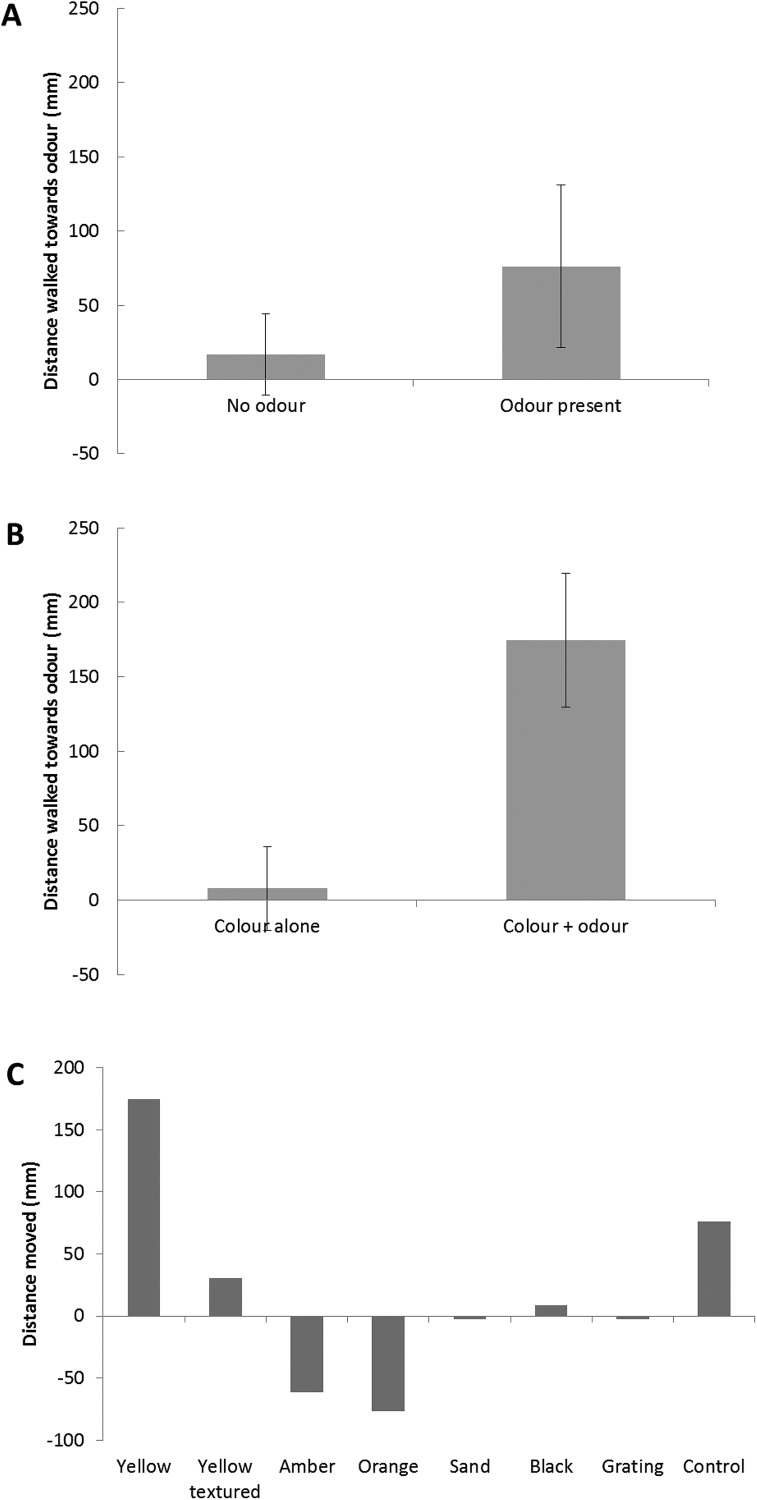
Figure 3. Distance travelled (mean ± s.e.m.) in direction of odour tube.
(A) by beetles presented with no visual stimulus, with and without odour (N = 17 insects) (without = neither blown air nor odour); (B) by beetles presented with the yellow visual stimulus during Period 1 (visual stimulus present, no odour/blown air) and Period 4 (both visual and odour stimuli present) (N = 31); (C) distance moved towards odour tube by all beetle cohorts, during Period 4 (both odour and visual stimuli present) (N = 147 insects) (negative values indicate net movement away from the tube). (“Control” bar = no visual stimulus presented.).

