Fig. 1.

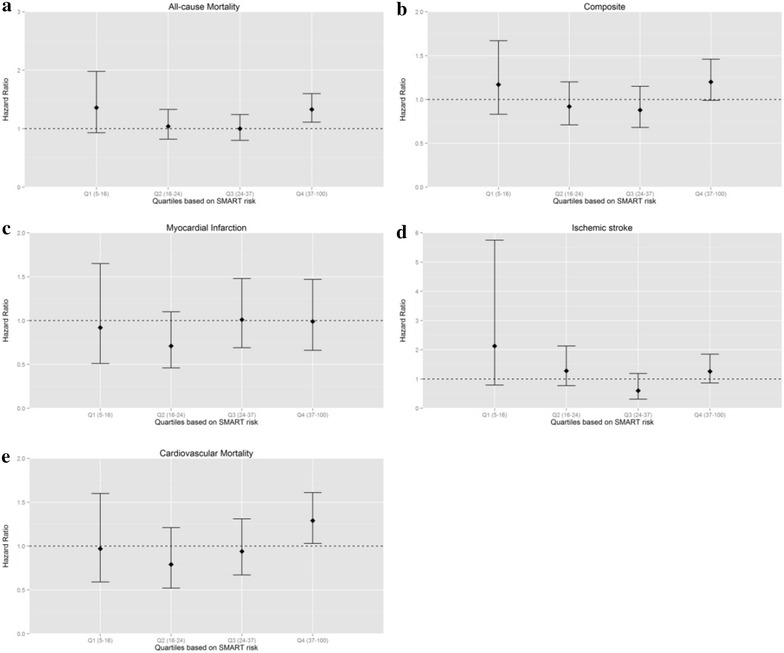
The relation between HbA1c and risk for new cardiovascular events or mortality in quartiles stratified by baseline risk. The relation between HbA1c and risk for each outcome under study is represented separately. The quartiles are denoted on the x axis with Q1–Q4 respectively. The SMART risk score range of each quartile is given between brackets. Hazard ratios are adjusted for sex, age, current smoking, non-HDL cholesterol, diabetes duration, systolic blood pressure and eGFR (MDRD). Figure 1 a–e show the association between the SMART risk score and risk for a specified cardiovascular event (b, c, d) or mortality (a, e). The SMART risk score calculates the 10-year risk for developing a new cardiovascular event in patients with a history of cardiovascular disease. For example, a person with a SMART risk score of 20 has a 20 % chance of experiencing a new cardiovascular event in the upcoming 10 years
