
Figure 1.
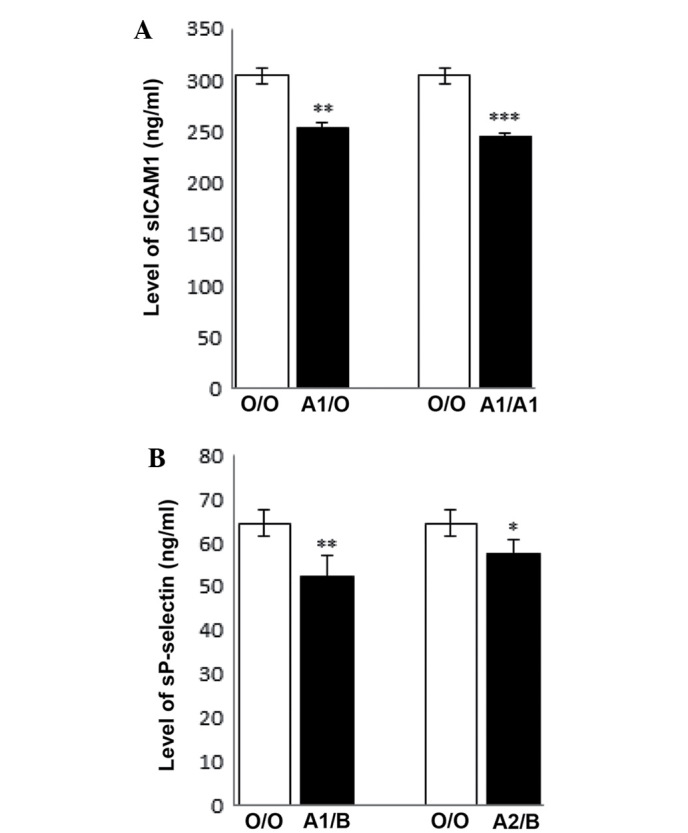
Expression levels of sICAM1 and sP-selectin in different genotypes. (A) sICAM1 expression levels in A1/O and A1/A1 groups compared with the O/O group. (B) Expression levels of sP-selectin in A1/B and A2/B groups compared with the O/O group. One-way analysis of variance was used to analyze the results. Data are presented as the mean ± standard deviation. *P<0.05, **P<0.01, ***P<0.001 vs. O/O. sICAM1, soluble intercellular adhesion molecule 1; sP-selectin, soluble P-selectin.