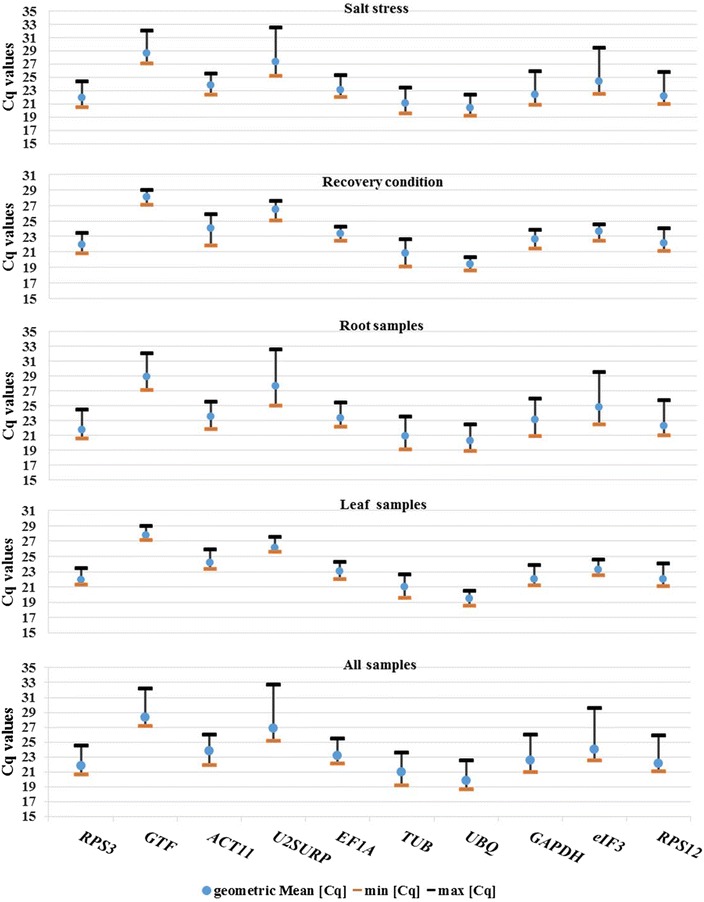
Fig. 3.

Box-plot of Cq values for the 10 candidate reference genes among all cDNA samples. The median values are showed as a line across the box. The first and third quartiles are represented as red and yellow boxes, respectively. The lower and upper whiskers indicate the highest and lowest values, respectively
