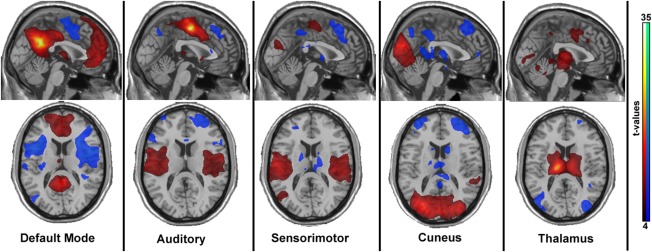
Figure 1.

The networks used for analysis, represented via one‐sample t‐tests as conducted with SPM. The maps are based on the individual z‐score maps of the first resting‐state measurement of the test‐retest measurements (n=20). Maps represent t‐values, thresholded between 4 and 35. Although the auditory and sensorimotor networks look similar, one seed was placed in the motor cortex (“auditory”), and the second in the temporal gyrus (“sensorimotor”) as published previously [Smith et al., 2009]. [Color figure can be viewed in the online issue, which is available at http://wileyonlinelibrary.com.]
