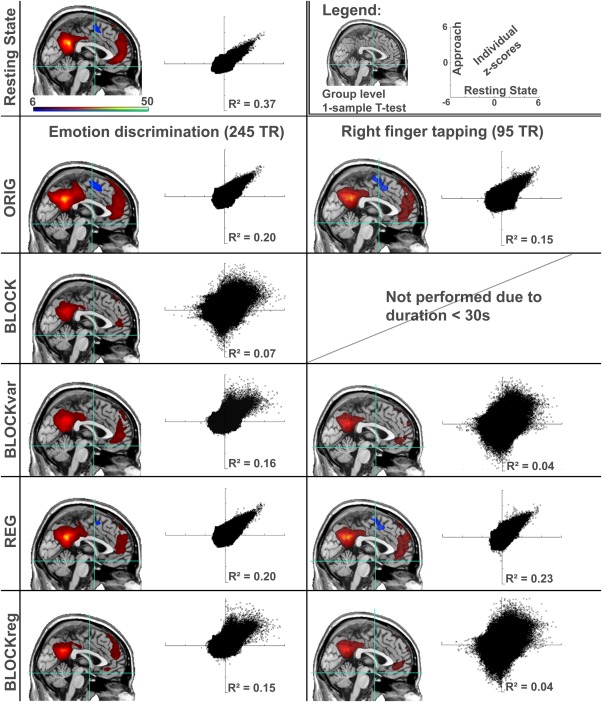
Figure 2.

Comparison between continuous and extracted resting‐state connectivity for the default mode network. Maps represent one‐sample t‐tests across the entire group for each method. In the scatter plots, resting state (x‐axis) and the according method of extraction (y‐axis) are compared for all brain voxels across all individual z‐score maps. Hence, the top left scatterplot represent test‐retest evaluation of two resting‐state scans. Scaling is uniform for all images (t‐values from 6.09–50, P<0.05 FWE‐corrected), and scatter‐plots (−6 to +6). For the finger‐tapping the BLOCK method is not shown, as the resulting signal comprised less then 30 s, and therefore considered too short. Visually, the networks are highly similar, but through further investigation marked differences can be found. [Color figure can be viewed in the online issue, which is available at http://wileyonlinelibrary.com.]
