Fig. 1.

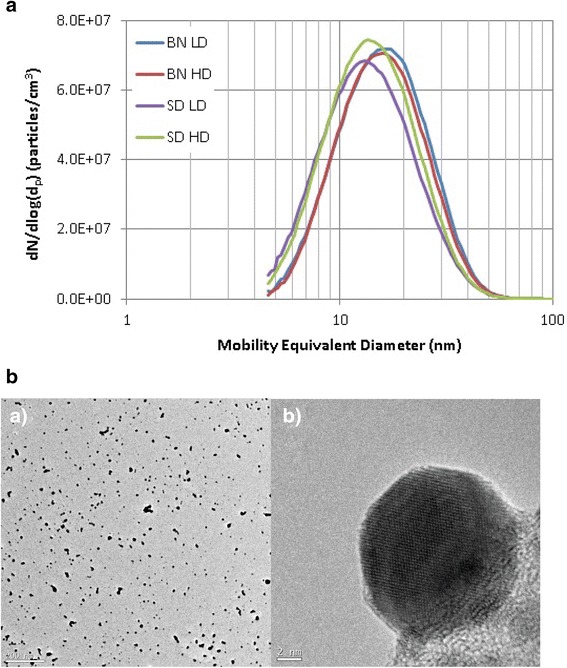
Panel a: Density of particles as a function of the diameter of silver nanoparticles measured during each of the experimental conditions for each rat strain. BN-LD: Brown Norway rats exposed to low dose; BN-HD: Brown Norway rats exposed to high dose; SD-LD: Sprague–Dawley rats exposed to low dose; SD-HD: Sprague–Dawley rats exposed to high-dose. Panel b: Representative high resolution transmission electron microscopy (TEM) images of aerosol particles delivered to the exposure manifold at 12,000X magnification (scale bar 200 nm) (Panel B a) and 800,000X magnification (scale bar 2 nm) (Panel B b)
