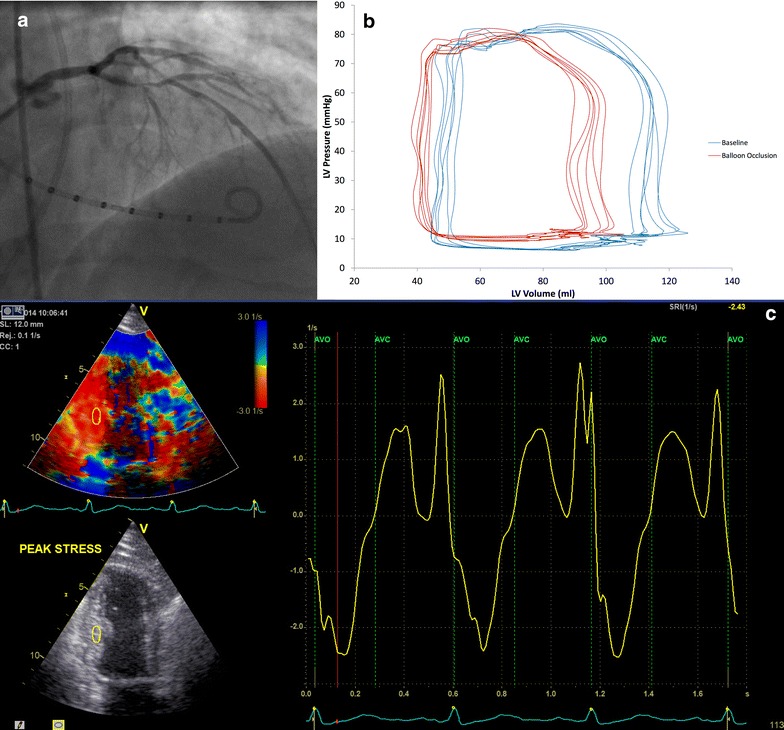
Fig. 2.

Examples of methodology. a Conductance catheter in position in the left ventricle during an injection of contrast into the left coronary artery. The proximal LAD lesion can be seen. b Pressure–volume loops generated at baseline (blue) and during occlusion of the LAD (red). c Dobutamine stress echo at peak stress. Strain rate is shown to the right with the peak systolic strain rate the most negative point between aortic valve opening and closure
