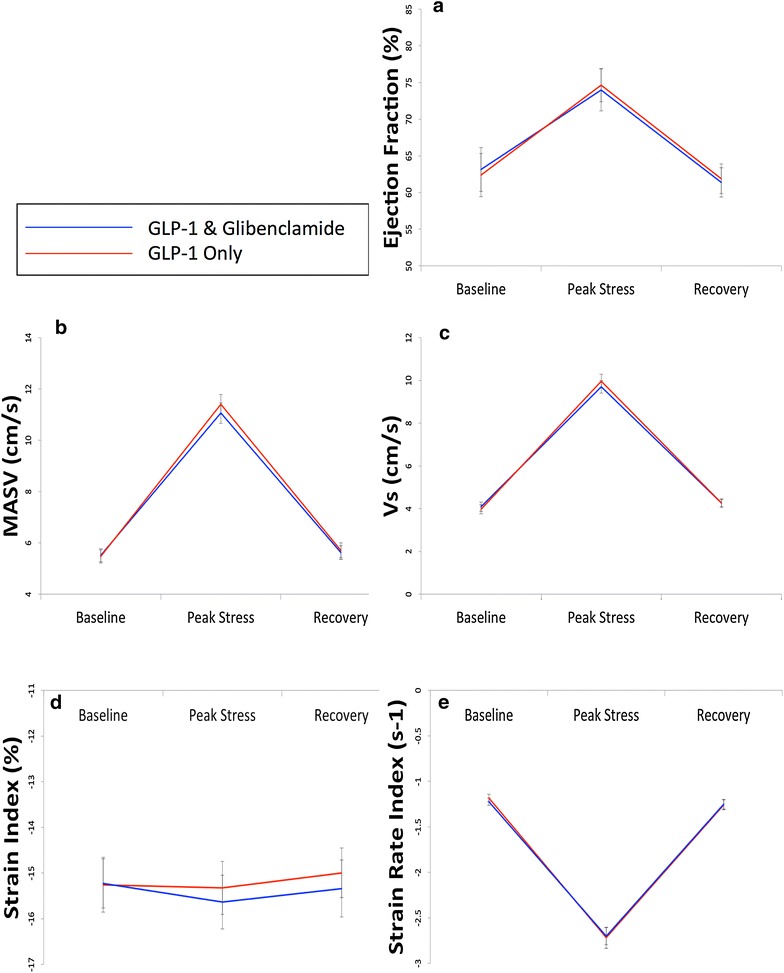
Fig. 5.

Systolic function in demand ischemia protocol. Mean ± SEM. Changes in global and regional systolic function at baseline, peak stress and 30-min recovery. There are no statistically significant differences between the two studies at any timepoint. a Ejection fraction. b Mitral annular systolic velocity. c Peak systolic tissue velocity (Vs). d Peak systolic strain (SI). e Peak systolic strain rate (SRI)
