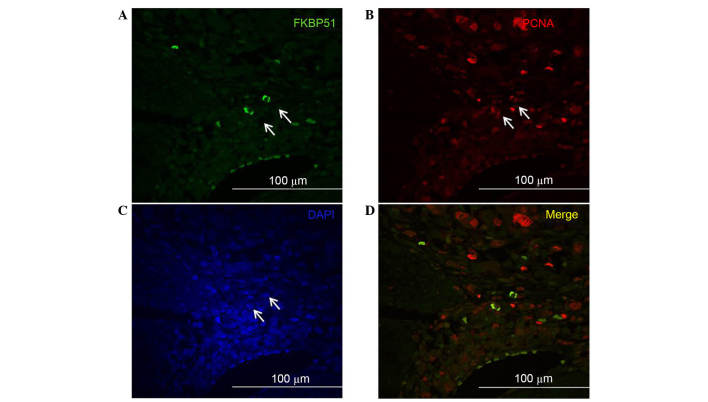
Figure 2.
Double immunofluorescence imaging on colorectal cancer tissue sections. Confocal images of (A) FKBP51 (green) and (B) PCNA (red) expression in stromal cells; only certain cells in the stroma co-express FKBP51 and PCNA (arrows). (C) Nuclei were visualized by DAPI. (D) Merged image of (A) and (B). FKBP51, FK506-binding protein 5; PCNA, proliferating cell nuclear antigen.

