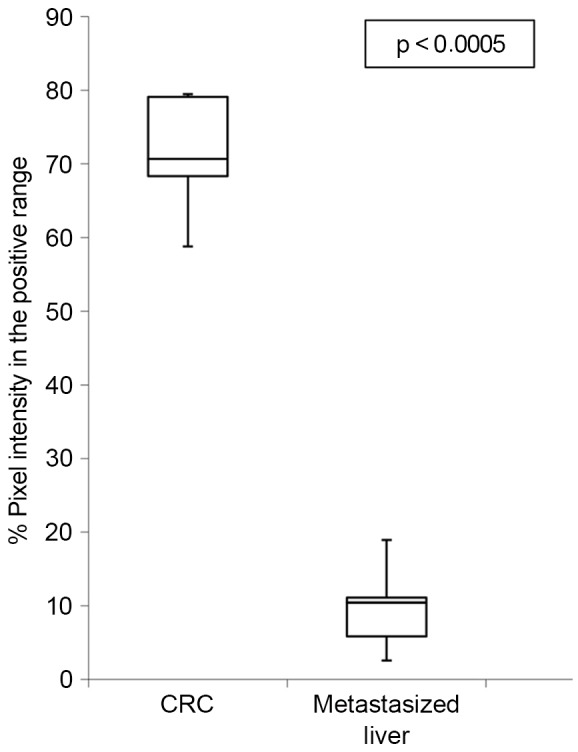
Figure 5.

Box-and-whisker plot illustrating FKBP51 downregulation in metastasized liver tissue sections compared to FKBP51 expression in CRC tissue sections. Boxes indicate interquartile ranges, whiskers indicate ranges of maximal and minimal values. FKBP51, FK506-binding protein 5; CRC colorectal cancer.
