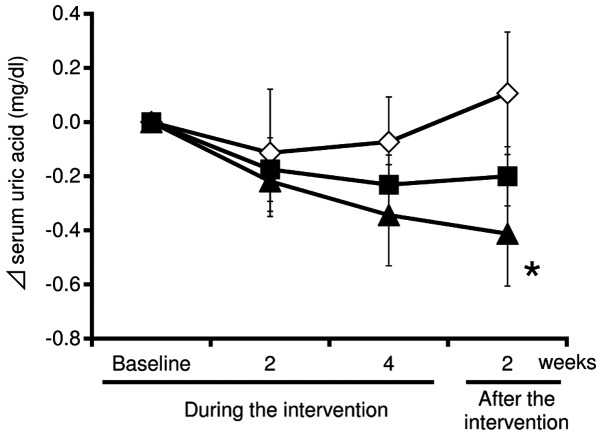
Figure 1.
Changes of the serum uric acid in the subjects of the placebo and test supplement (at low and high doses of tuna extract) groups during and subsequent to the intervention. Serum uric acid levels were analyzed using serum samples collected from the subjects in the groups of placebo (n=15; open diamonds) and test supplements at low (n=16; closed squares) and high (n=16; closed triangles) doses of tuna extract during and subsequent to the intervention. The absolute change from the baseline was calculated and plotted. The data are expressed as the mean ± standard error. *P<0.05 when compared with the placebo group.

