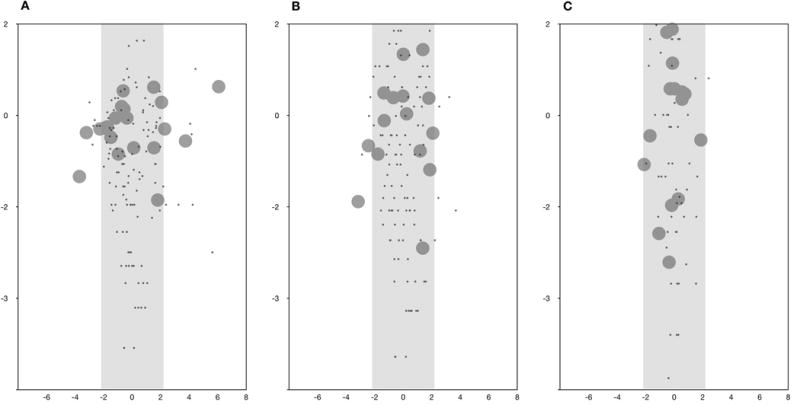
Figure 2.

Developmental pathway maps. A) Preliminary 20-item, 5-category-response instrument; B) Modified 15-item, 3-category-response instrument (upon analysis of the phase I dataset); C) Final 15-item, 3-category-response instrument, the CAP-PRI (analyzed from the phase II dataset). Item difficulty-person ability probability map is on the vertical (y-axis) logarithmic scale (logits) and more difficult items (large circles placed higher on the vertical access) are more appropriate for more disabled patients (black dots). These Figure (A, B, C) shows that coverage of severity status of the scale improved with each modification. Item fitting is on the horizontal (x-axis) scale. Mis-fitting items are outside the shaded box (2A) and were subsequently removed or modified, as discussed in the Methods and Results. Figure 2C demonstrates that none of the 15 items in the final scale were misfitting. Z-score| > 2).
