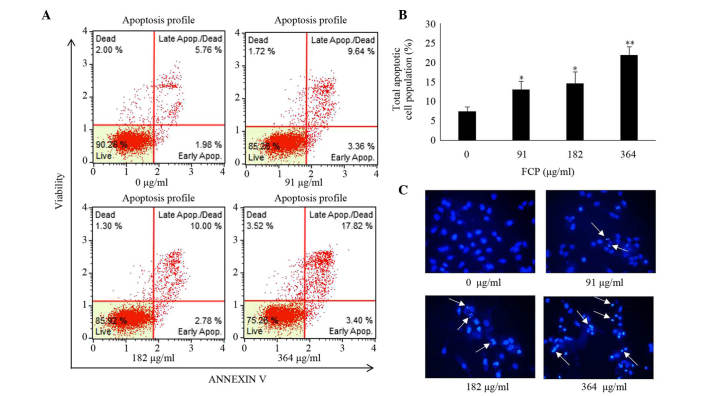
Figure 4.
FCP induced apoptosis of A549 cells. (A) A549 cells were treated with FCP at the indicated concentrations for 24 h, and apoptosis was assessed by Annexin V-propidium iodide double staining using Mini Flow Cytometry Muse™ Cell Analyzer. (B) Quantitative data indicate that total apoptosis significantly increased in 182 and 364 µg/ml FCP-treated cells Data were expressed as the mean ± standard deviation of three independent experiments (*P<0.05, **P<0.01 vs. control). (C) Hoechst 33258 staining of A549 cells treated with or without FCP for 24 h (white arrows indicate fragmented or condensed nuclei; magnification, ×200). Apop, apoptosis; FCP, flavonoids from Citrus platymamma.

