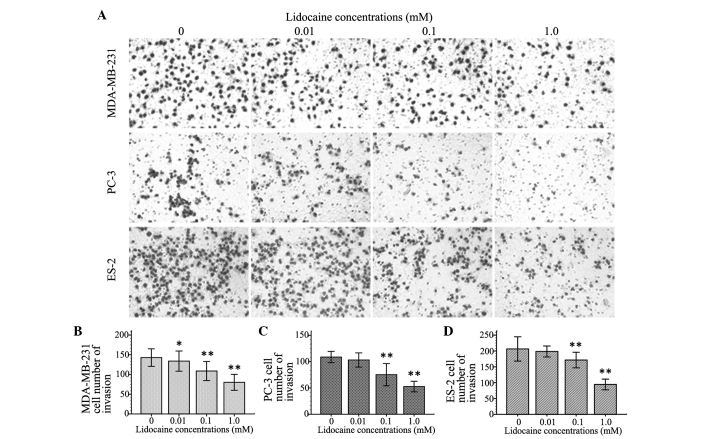
Figure 3.
Effect of lidocaine on the invasion of transient receptor potential cation channel subfamily V member 6-expressing cancer cells. The cells were exposed to different concentrations (0 µm, 10 µm, 100 µm and 1 mM) of lidocaine for 24 h. (A) The invasion of cells was evaluated by the Transwell chamber invasion assay and the number of invasding cells was counted after staining with azure eosin methylene blue (×200 magnification). The histograms represent the number of (B) MDA-MB-231, (C) PC-3 and (D) ES-2 cells that penetrated the polycarbonate filter membrane with regard to different concentrations of lidocaine, and the data are shown as the mean ± standard deviation of three independent experiments. *P<0.05 and **P<0.01 vs. control group.

