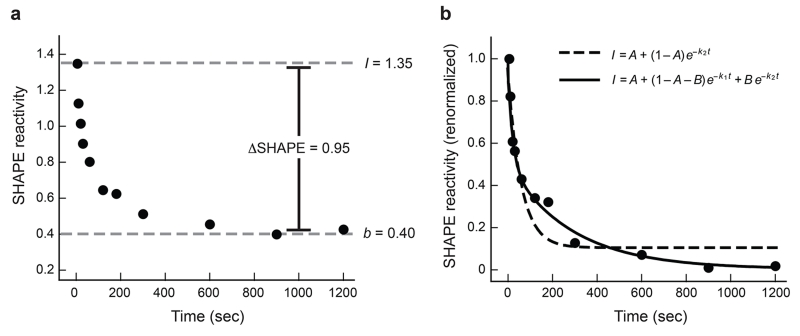
Figure 2.
Analysis of time-progress curves. Nucleotide G217 of the RNase P specificity domain is shown. (a) Representative change in SHAPE reactivity as a function of time. Y-axis data are shown using absolute SHAPE reactivities that have been normalized to a scale that spans 0 to ~1.5, where 1.0 is defined as the average intensity of highly reactive positions. The absolute change in SHAPE reactivity at this nucleotide is 0.95, which means the time-progress curve can be quantified at a high level of accuracy and significance. (b) Quantitative analysis of time-resolved changes in local nucleotide flexibility. Data from panel A have been renormalized on the y-axis such that reactivity at time = 0 is defined as 1.0 and is obtained by dividing by the initial maximum intensity (I = 1.35), after first subtracting the plateau SHAPE reactivity (b = 0.40). Most nucleotides tend to follow simple kinetic behavior and are well fit using straightforward kinetic equations. A double exponential (solid line, Eqn. 2) is the best choice for these data.

