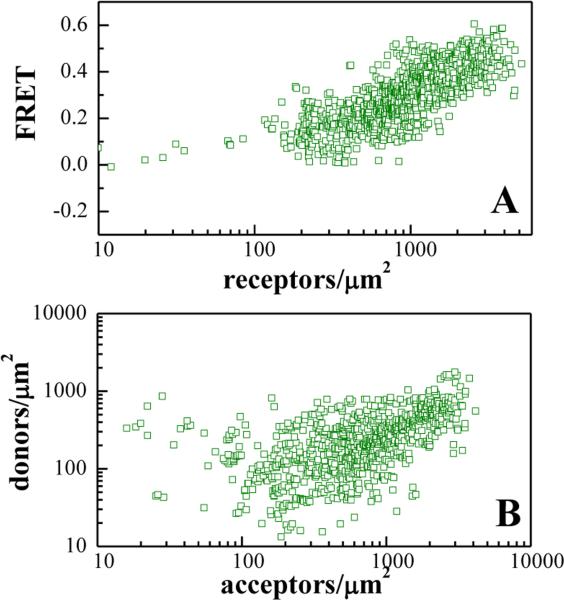
Figure 4. FRET efficiencies and concentrations measured for the YSA-bound EphA2 L223R/L254R/V255R mutant.
(A) FRET as a function of receptor concentration. Every data point represents a single membrane region such as the one shown in Figure 1. (B) Receptor donor concentration plotted as a function of receptor acceptor concentration in each membrane region analyzed.

