
Figure 3. Network analysis of human pre-implantation development.
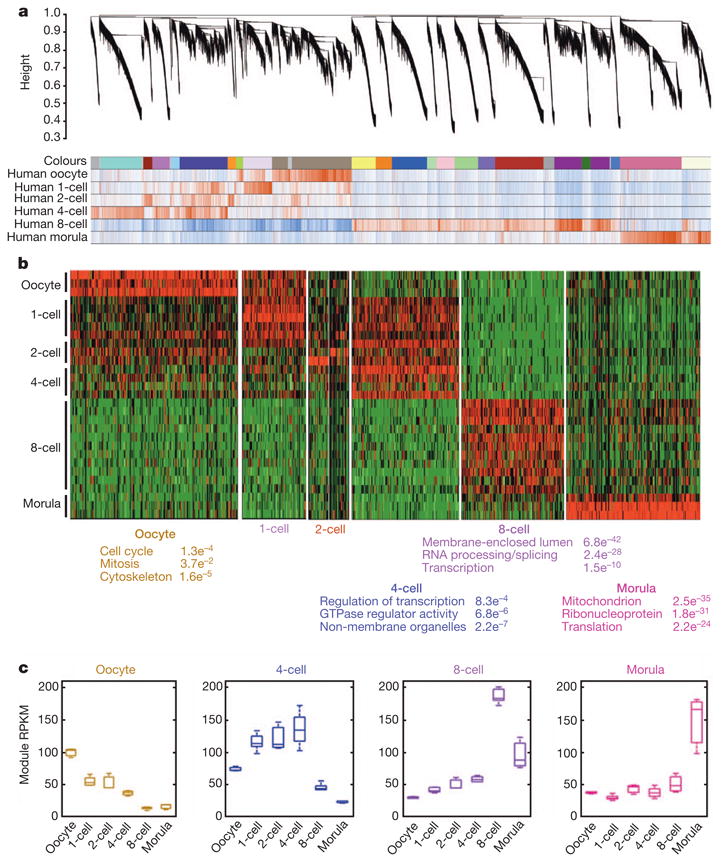
a, Hierarchical cluster tree showing co-expression modules identified using WGCNA. Modules correspond to branches and are labelled by colours as indicated by the first colour band underneath the tree. Remaining colour bands reveal highly correlated (red) or anti-correlated (blue) transcripts for the particular stage. b, Heatmap showing relative expression of 7,313 genes in 7 representative stage-specific modules across all samples. As each developmental window only has one or two highly correlated modules, the modules were assigned biological names. Top three representative gene ontology terms and their associated functional enrichment P values are shown below. c, Boxplots showing the distribution of module expression (mean RPKM of all genes within a given module) for different cell types.