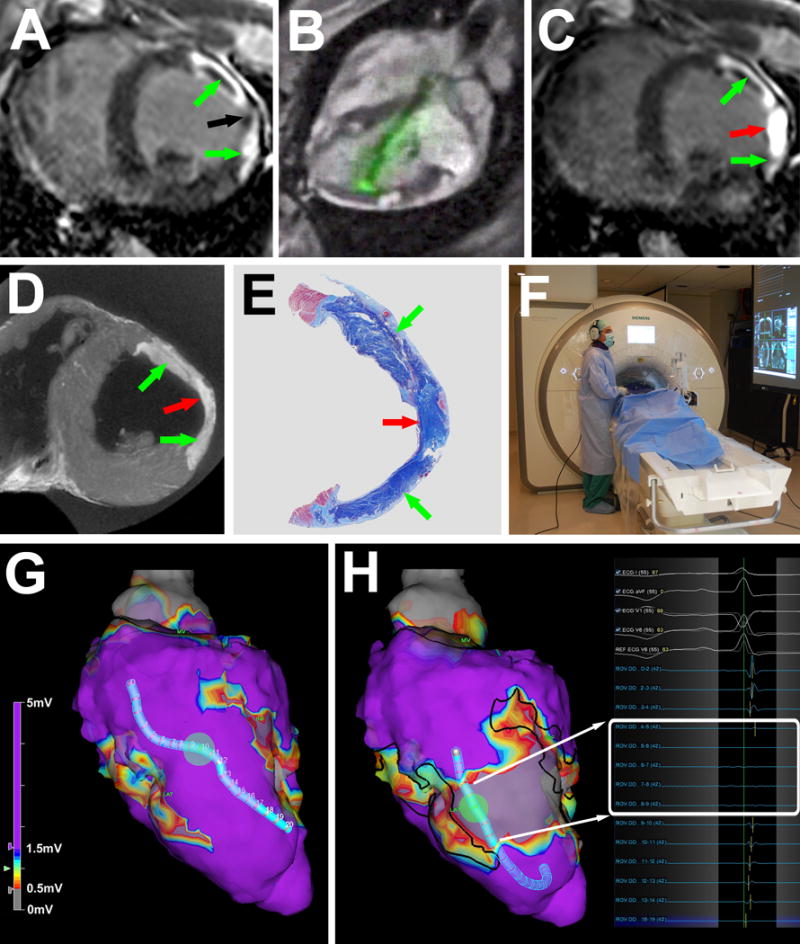
Figure 1.

MRI guided chemoablation of a conductive isthmus. (A) Baseline LGE showing two infarcts (green arrows) with isthmus of normal myocardium (black arrow). (B) Real-time MRI guided chemoablation. The active visualization injection needle appears in green. (C) LGE after chemoablation showing infarcts (green arrows) and transmural chemoablation lesion (red arrow). (D) After 7 days, ex-vivo high-resolution MRI confirms transmural chemoablation lesion (red arrow) confluent with both infarcts (green arrows). (E) Wide-field Masson trichrome stain of a section in the same orientation as panels A, C and D. Normal myocardium appears pink, necrotic myocardium appears purple and fibrotic tissue appears blue. (F) The operator wears a noise-cancelling communications headset. Real-time MRI and hemodynamics are displayed in the room. (G) Endocardial voltage maps at baseline showing normal amplitude electrograms throughout the conductive isthmus. (H) Post-chemoablation, a band of very low (<0.5mV white box) voltages interrupts the isthmus. Black lines represent the margins of the original infarcts. LGE: late gadolinium enhancement.
