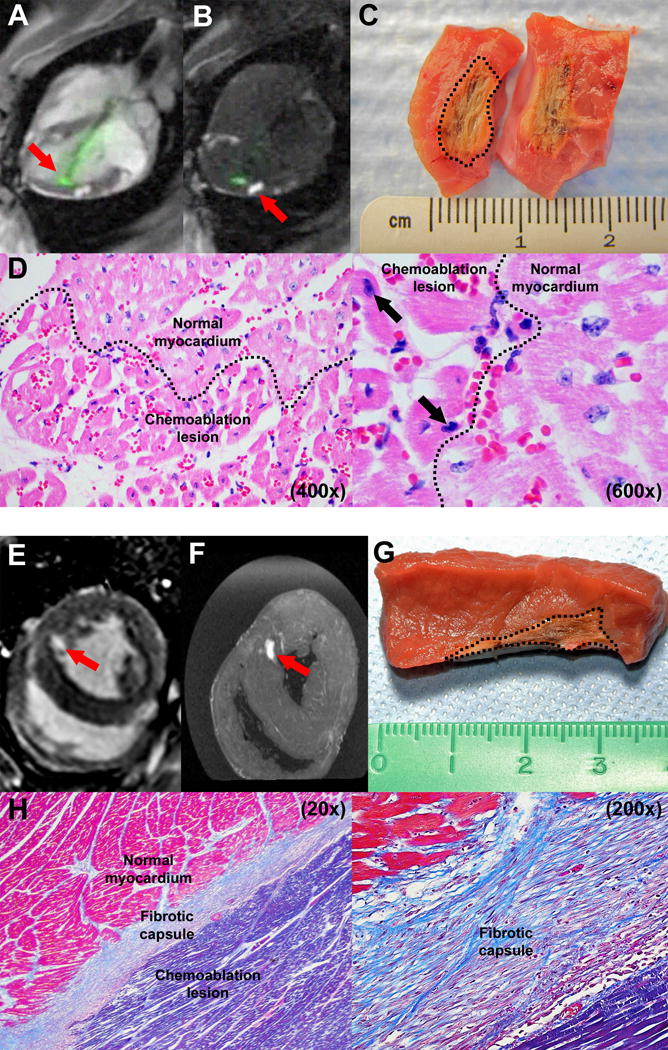
Figure 2.

Ablation imaging and histology. (A) Real-time MRI during chemoablation. The active visualization injection needle appears green (arrow). (B) Real-time inversion-recovery MRI darkens normal tissue and highlights chemoablation lesions containing gadolinium contrast (arrow). (C) Macroscopic appearance of an acute lesion, which has been butterflied open. The dotted line marks lesion margins. (D) Histology of acute lesion with H&E stains (400× and 600× magnification). Affected myocardial fibers are hypereosinophilic with pyknotic nuclei (black arrows). Dotted line marks border between chemoablation lesion and normal myocardium. (E) Late gadolinium enhancement and (F) ex vivo MRI of a chronic lesion after systemic gadolinium contrast administration. (G) Macroscopically, chronic lesions have well circumscribed margins (marked with dotted line). (H) Histology of a chronic lesion with trichrome stain (20× and 200× magnification). Collagen stains blue, normal myocardial fibers stain red and necrotic myocardial fibers stain purple.
